


Bitcoin has climbed back above $73,000 from lows that saw the Crypto Fear & Greed Index in single-digit fear, and with that recovery has come a familiar chorus of the bottom is in, the next leg up is approaching, and the cycle is ready to turn bullish again. One analyst on X, however, is not buying it, and his reasoning is based on one of the most consistent patterns in Bitcoin’s price history.
Why Rising Bullish Sentiment Can Cause More Downside
Bitcoin’s sentiment is now slowly turning bullish again, which is a reflection of its price action in recent days. However, according to crypto analyst Max, the gradual return of optimism across social media and trading circles is a warning sign.

Max, who shared his outlook on X alongside a multi-cycle Bitcoin chart, proposed that the re-emergence of bullish sentiment at this point is precisely what should concern investors. “When sentiment slowly starts turning bullish again,” he wrote, “that’s usually your sign that the bottom isn’t in yet.”
Max pointed out that recent discussions around a cycle bottom forming already, along with predictions of a historic rally, mirror sentiment conditions that have always appeared before further downside moves. In short, the crowd turning optimistic too early could mean the market has not yet completed its corrective phase.
This outlook is based on the fact that the Bitcoin price has not yet produced the structural conditions that have historically confirmed cycle lows. He identifies three specific cycle low signals that are currently absent on the Bitcoin chart: total capitulation, repeated sweeps of the lows, and a confirmed change in market structure on the weekly timeframe.
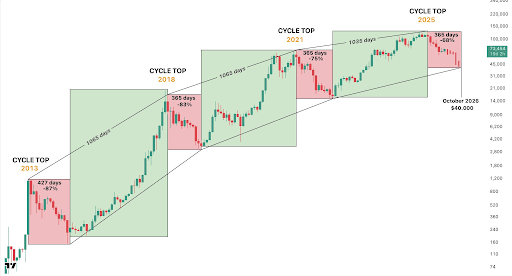
Bitcoin Price Chart. Source: @_ctm_crypto On X
Cycle Timing Puts The Bottom In October
The most interesting part of this technical outlook is the cycle comparison overlaid by Max onto Bitcoin’s full price history. Previous Bitcoin cycles show a consistent rhythm of extended accumulation and expansion phases followed by lengthy corrections.
From the 2013, 2018, and 2021 cycle tops, Bitcoin required around 365 days of decline before reaching a definitive bottom. Interestingly, each cycle was characterized by a smaller decline by the previous one. The 2013 top was followed by a 427-day decline of 87%, the 2018 top brought a 365-day drop of 83%, and the 2021 top saw a 365-day correction of about 75%.
The projected path suggests a similar structure is still playing out in the current cycle since the October 2025 peak. Projecting that structure forward from the 2025 cycle top, Max’s chart targets October 2026 as the likely bottom window, with a projected price of $40,000.
This bottom would align with both the duration and magnitude of previous bear phases, instead of the much faster recovery some market participants are expecting. At the time of writing, Bitcoin is trading at $74,590, up by 5.4% in the past 24 hours.
Featured image from Dall.E, chart from TradingView.com

Editorial Process for bitcoinist is centered on delivering thoroughly researched, accurate, and unbiased content. We uphold strict sourcing standards, and each page undergoes diligent review by our team of top technology experts and seasoned editors. This process ensures the integrity, relevance, and value of our content for our readers.